Context-specific sonification.
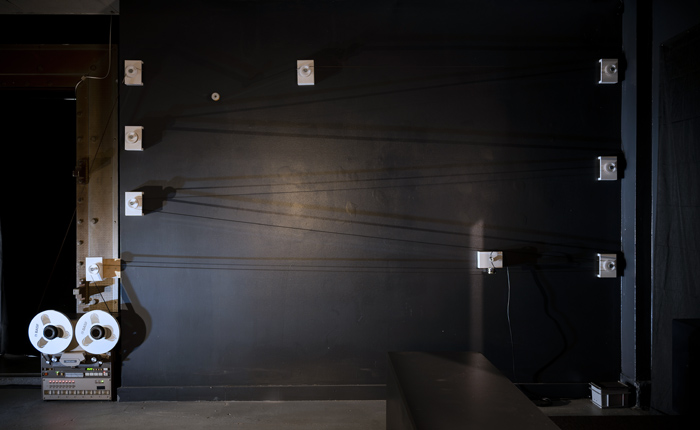
9-channel audio, live-input magnetic tape loop (22-meter long), video projection 2 hour 32 min loop, satellite ocean data, iron print.
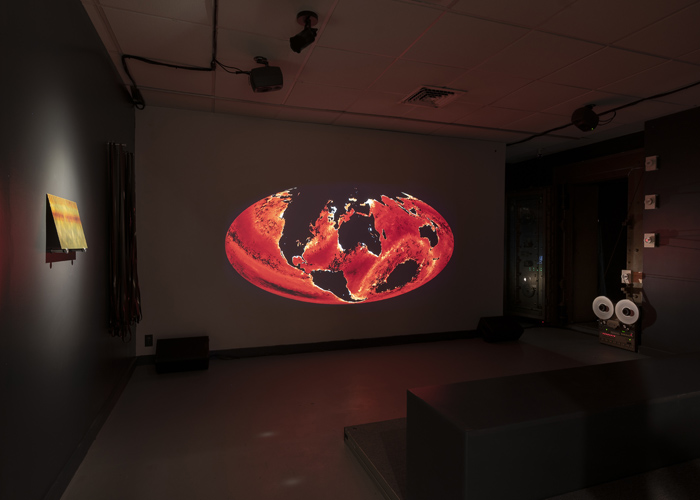
Chlorophyll-Ocean-Iron-Breath unravels the longest running remote sensing ocean chlorophyll dataset by way of cartographic projections and satellite signal audification. Selective oceanic components holding land-lungs in attention are circulated through marine residue from the same material substrate that binds oxygen-metabolizing lungs (iron oxide). The installation sounds a tangle of reciprocities that participates in worldwide impressions of oceans breathing.
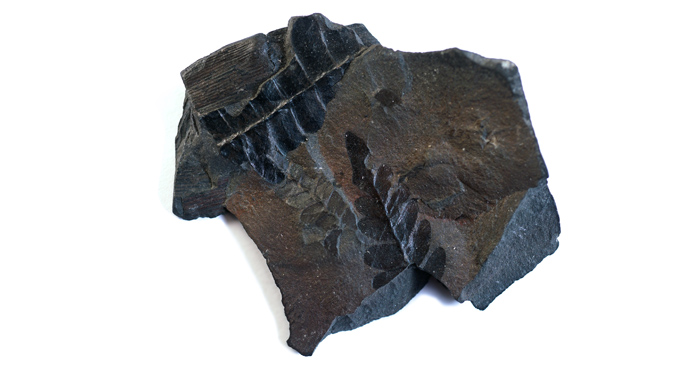
Every second breath on earth is derived from oxygen produced in oceans. Marine phytoplankton, cyanobacteria, and algae emit oxygen during photosynthesis in an ongoing process through which the Earth first acquired its oxygenated atmosphere. Chlorophyll-bearing organisms – the distribution of which is estimated by way of satellite monitoring of ocean spectral data – are a key oxygen producer (approximately 50% of world oxygen) [01] and also a critical component in earth’s carbon cycle as well as constituting the base of the marine food web. Fossil fuels, currently shortening breaths, are themselves remnants of ancient marine algae whose aeration has long expired. Approximately 2.4 billion years ago, long before oxygen-metabolizing lungs existed, dissolved iron in the oceans merged with the photosynthesized oxygen, depositing brown, ocher, and red layers of rust (iron oxide) in seabeds worldwide. This period in which the Earth’s atmosphere was initially aerated with ocean-produced oxygen is known as the Great Oxidation Event (GOE).
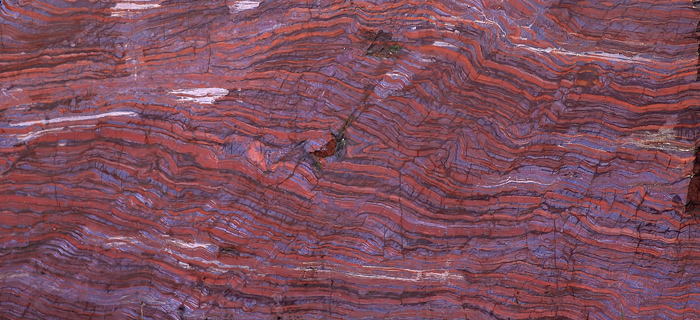
Brownish-red magnetic tape derives its color from the same mineral compound found in banded iron formations of prehistoric ocean basins. Even before audio is impressed upon it, magnetic tape is in some ways already a recording of oceans breathing. The characteristic tape hiss is its soundtrack.
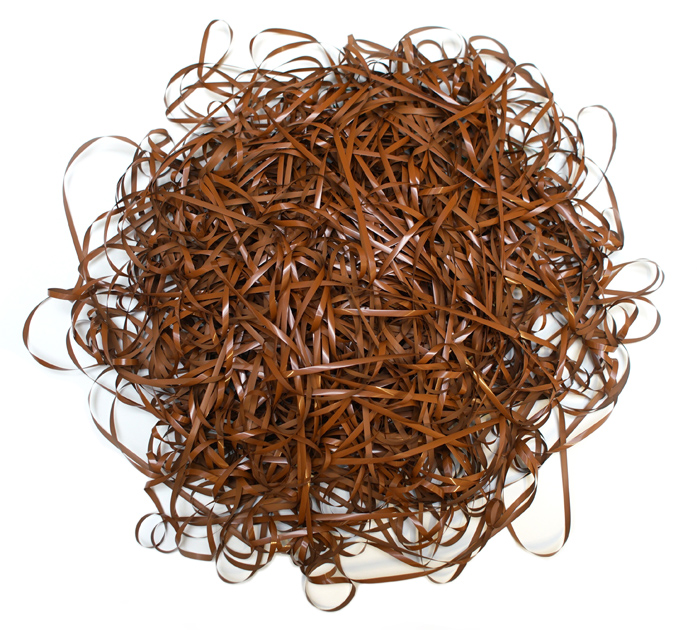
Magnetic tape has been crucial in making underwater sounds resound in air especially as an analytic tool in oceanography, marine zoology and underwater tactical research. A six-channel 22 meter-long tape-loop in the installation continually plays back and rerecords spatially rendered fragments of satellite chlorophyll data, accumulating magnetized layers in an ongoing audio sedimentation.
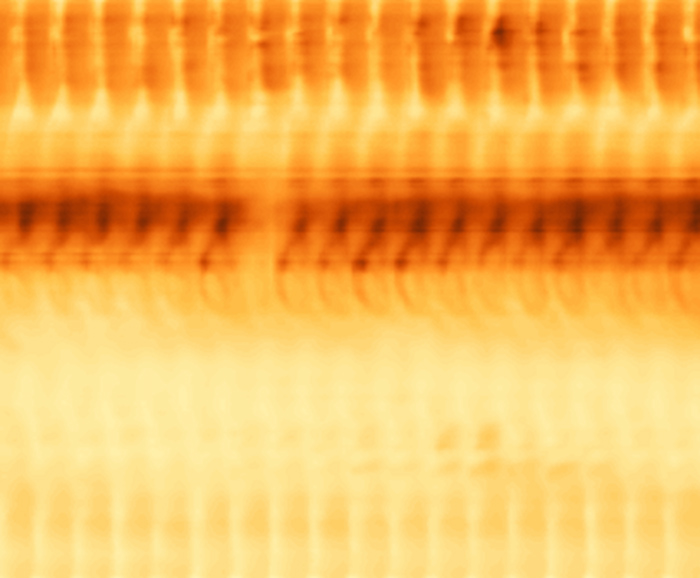
Ocean iron distribution estimates are mathematically derived from a combination of factors including monitored ocean chlorophyll values. Iron is a crucial phytoplankton nutrient employed in electron transfer reactions during photosynthesis. However, iron is highly insoluble in seawater and requires auxiliary processes to come into contact with phytoplankton. Ocean iron fertilization causing expansive seasonal algae blooms, occurs through current upwells of seabed sediments or is activated by windborne dust and ash carried from land to sea. Whale feces are another important iron source. The Hunga Tonga–Hunga Haʻapai volcanic eruption of January 15, 2022, instigated a large phytoplankton bloom fed by nutrients released in the blast. [02] Worldwide distribution of phytoplankton reflects the presence of water nutrients as well as the predominant ocean streams and eddies. Geoengineering experiments currently underway test artificially induced blooms by seeding oceans with iron filings. The ongoing two-channel drone in the installation sonifies ocean iron estimates, collected by NASA between 1998-2015. The audio synthesis involves rendering the ocean iron database as a single image, where X-axis is time and Y-axis is a north pole to south pole longitudinal average, that is then re-mapped into an audio timeline (X-axis time and Y-axis audio spectrum) with left and right channels corresponding to the southern and northern hemispheres. The 17-year iron projection also appears printed, left of the entrance, on an iron plate.
Early links between breathing and oceans appear on a woodcut world map printed in Ulm in 1482, based on a method devised by the Roman cartographer Claudius Ptolemy. The map depicts a flattened Earth surrounded by 12 ‘wind heads’, distributed longitudinally every 30 degrees, whose breathing unknowingly turns ocean gyres. Equatorial winds from the easterly Apeliotes head, crucial for seafaring navigations, are now known to be particularly important for upwelling of nutrient-rich cooler deeper waters capable of producing annual algae blooms extending thousands of kilometers. Ptolemy’s second projection method is the earliest known mapping technique to include a gridded longitudinal and latitudinal system linking graphic representations of the Earth with temporal and climatic zoning systems. The 1482 edition was manufactured with German woodcut reproduction technology facilitating broad circulation of Ptolemy’s Geography atlas (Geōgraphikḕ Hyphḗgēsis) consolidating 2nd century Roman Empire cartography. The agency of world-spanning maps was paramount for a spatially distributed empire that curved over the horizon. Book VII of the atlas details instructions for producing a world map by geometrically projecting the surface of a globe into a flattened surface whose spatial articulations can be apprehended with a single glance which was an innovation in optical command of territories that was not the case with earlier maps constrained to a globe.
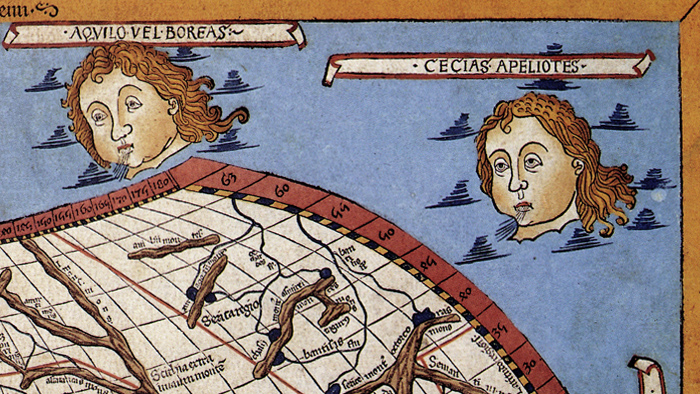
Woodcut blockprinting spread though Europe from China in the late Middle Ages, revolutionizing map reproductions and book distribution through mechanized printing, synchronizing movable type techniques with woodcut illustrations such as the Ulm version of Ptolemy's map. During the Carboniferous period, vast swaths of trees and other land vegetation, originating in ocean algae, produced worldwide carbon deposits (at a time before biodegrading organisms existed) that eventually resurfaced to fuel the Industrial Revolution. Trapped carbon found in Carboniferous coal beds led to an excess of terrestrial oxygen (reaching over 30% of air composition, compared with today’s 21%) that is thought to contribute to developments of insect and amphibian gigantism as well as the co-evolution of wildfires and trees. [03] [04]
Unfolding the globe onto a flattened map surface involves tradeoffs that at times reveal the mapmaker’s bias. The projection process inevitably produces geometric deformations that can make continents seem much larger or smaller than they physically are. When the National Geographic Society changed its world emblem to the Robinson projection in 1988, the visual scale of the Soviet Union shrank from 223 percent of its actual size to a mere 18 percent enlargement. The Robinson projection, intended as a perceptual compromise between azimuth and land distortion mapping artifacts, was devised in 1974 by Arthur Robinson – who had served as director of the map division of the Office of Strategic Services during the World War II – but had to wait over a decade before land areas were permitted to shrink visually, in proportion with a diminishing Soviet menace.
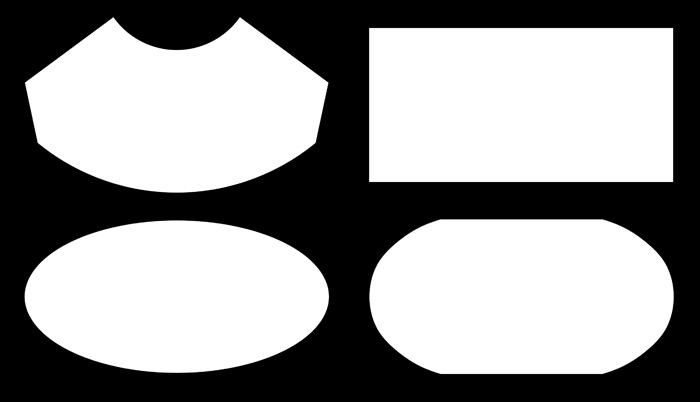
Various methods are employed for stitching satellite ocean data into world maps, though the predominant database projection (Mercator) is based on a lost geographical treatise of the Greek cartographer Marinus of Tyre, known only through Ptolemy’s writings. Marinus’ equirectangular projection, with its inherent spatial distortions (especially nearing the poles) had little use during the development of seafaring navigation. Nearly two thousand years later, the projection meshes surprisingly well with a multitude of pixilated earth monitoring datasets conveyed in gridded RGB values. Karl Mollweide’s elliptical projection method, devised in 1805 for stellar mappings, peers at the heavenly sphere from its inside. Today Mollweide is the most recognizable projection-profile, employed in mapping anything from the earth up to the largest knowable sphere of cosmic microwave background radiation. Curiously, the Mollweide outline itself resembles the contours of a human eye. Projections in the installation are derived from a 19-year ocean color monitoring (the longest ocean chlorophyll dataset to date) spanning Feb 2003 - Feb 2022 from NASA’s chlorophyll repository, projected through Mollweide’s elliptical flattening where the earth completes a single cycle with each rotation of the 19-year data-set span.
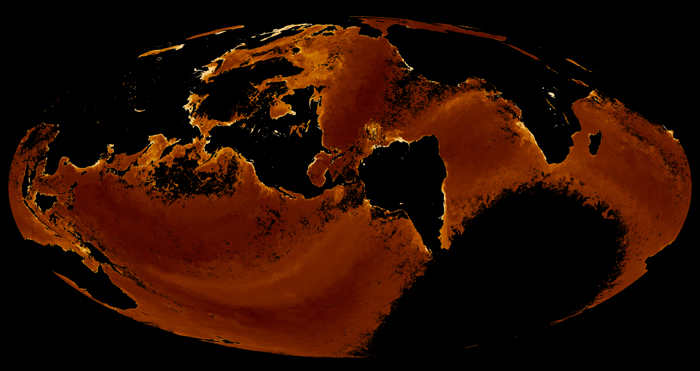
Ocean oxygen emissions into the atmosphere are estimated through satellite observations from beyond the atmosphere by way of reflected sunlight, received on photosensitive devices tuned to spectral signatures of ocean chlorophyll. The monitoring circuit incorporates electromagnetic projections traveling from the sun, to oceans, to sensors, to radio transmitters, to computer monitors and radiating back out into the open air. Materialities deposited in the wake of electromagnetic reflections imprint terrestrial features in multicolor spectral traits. Ocean color, tainted from the thickness of air through which it’s observed, is algorithmically gleaned from measurements and remapped to alternate color palettes. Worldwide chlorophyll data – scanned on a daily basis – are sent back to earth via radio transmissions, a process through which images shift spectrums and gain durations.
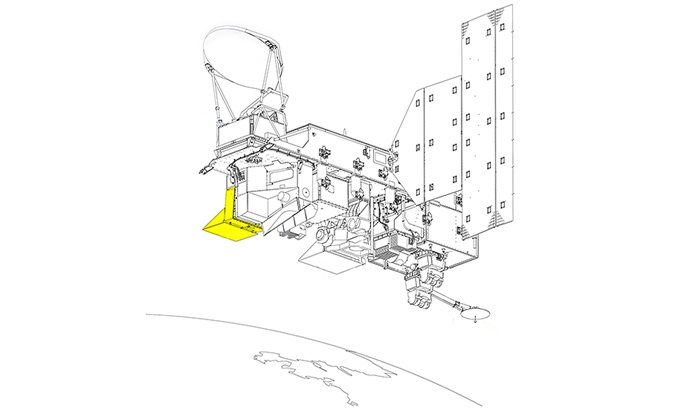
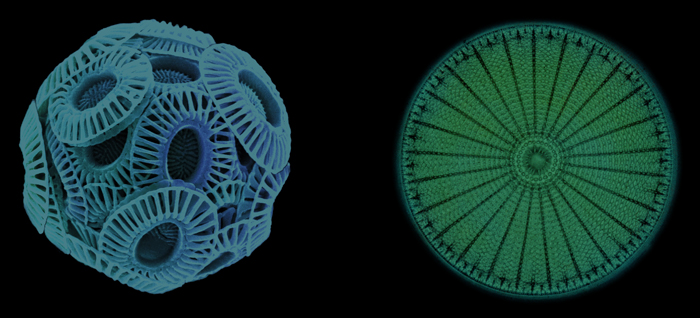
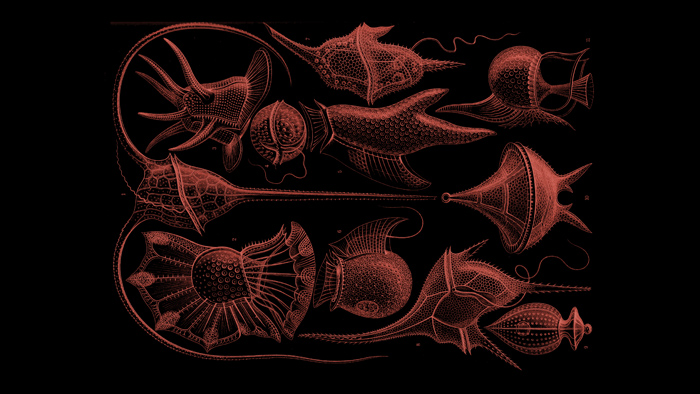
Unlike the terrestrial day/night cyclic pattern produced by earth’s rotation, satellites monitoring oceans sustain sun-synchronous orbits. The Aqua earth-monitoring satellite enjoys a perpetual daytime, suspended in the same mean local time above where it travels. Satellite attention to ocean-color favors specific pitches. Global chlorophyll hues are collected on the MODIS (Moderate Resolution Imaging Spectroradiometer) sensor onboard NASA’s Aqua satellite tuned to chlorophyll ocean surface reflections in the 440 - 670 nm wavelength range, a bluish-green region of the visible spectrum. Phytoplankton’s action spectrums (absorption maxima) peak at the 443 nm (blue) and 670 nm (red) wavelengths, giving ocean reflections their specific appearances when in bloom. Observed from the outer atmosphere, milky blue waters are likely saturated with coccolithophores whereas in greenish waters diatoms abound. Polar water algae blooms are particularly pronounced when sunlight encounters delayed nutrient upwells as winter darkness subsides. In the northern hemisphere, diatom blooms culminate in May and June, followed by the coccholithophores as water nutrients are depleted. Upon dying, the diatoms drop en masse to the ocean floor in a form of underwater precipitation known as ‘marine snow’, constituting a significant mineral sink due to their calcium or silicone-carbonate shells.
Color reception at the satellite sensor is reduced to less than 10% of its ocean-surface luminosity due to light scattering through the gaseous atmosphere. Mathematical calculations are applied to the sensor data in order to retrieve the water’s surface reflections. Color processing algorithms – such as NASA’s l2gen – combine wavelength-specific sensor measurements that increase the spatial resolution of murky bluish-greens. MODIS’ spectral analysis algorithm (chlor_a) implements an additional calculation (ABI bio-optical algorithm) developed by Palanisamy Shanmugam of the Indian Institute of Technology, Madras that excels at determining chlorophyll distribution in even more complex turbid water conditions around the Arabian Sea, Gulf of Aden and the Red Sea. [05]
Phytoplankton overabundance results in tensions underwater when attracting oxygen-consuming microbes that produce oxygen-depleted ‘dead zones’ suffocating nearby marine life. Red-tinted cyanobacteria like the ‘sea sawdust’ in the Red Sea, or the bright red dinoflagellate, naturally render in shades of human alarm. Harmful algal blooms, known as ‘red tide’, can also contain potentially lethal nerve-blocking toxins, though the Red Sea algal colonies also provide important minerals to nutrient depleted waters. Trichodesmium cyanobacteria (sea sawdust), considered a distant relative of the original photosynthesizing eukaryotic algae, are particularly talented in capturing iron-rich desert dust and converting it to dissolved iron that then becomes available to other phytoplankton. [06]
Not all red tide is naturally red, sometimes its color is expressive of the data mapping process itself: Earth monitoring mappings often default to a generic cold-to-hot visual gradient where warmer colors signify intensity or abundance. Color-coded spatial data reveal a synesthetic streak in the history of science that increases with the ease of digital mapping conversions, enforcing absent-minded modes of visual literacy. Stephan Helmreich recently pointed out a trove of global ocean mappings steeped in rainbow symbolism with “hyper-saturated red as a sign of seas in peril”. [07] When selecting a cold-to-hot color gradient mapping, excess chlorophyll values (above 4 mg per cubic meter) default to red in the visualized data, likely a carry-over from red-alert signals that themselves are carry-overs from attention to ochre pigments, or experiences of radiant wildfires, or simply residue from a red-rusting blood that still, continually, degasses the breath.
Ocular attention to red, the longest and slowest of visible oscillation, is thought to have co-evolved in primates (and birds) with the hues of ripening fruits. Long after chlorophyll has left the oceans it continues to weave refractions, enmeshing with countless other energetics, continually unfolding in the multitude of situated sunlit matters. Observing the eventfulness within everyday things provides some access to those ongoing reciprocities, like sensing eons of interactions in the hue of a fruit, or hearing transitioning oceans in particles of magnetic tape, or reading dubious sovereignty in the contours of a map.
Notes
[01] NOAA, How much oxygen comes from the ocean?, National Ocean Service website, https://oceanservice.noaa.gov/facts/ocean-oxygen.html
[02] O’Callaghan J., Burst of Underwater Explosions Powered Tonga Volcano Eruption , Nature News, 08 June 2022, https://doi.org/10.1038/d41586-022-01544-y
[03] Dudley R., Atmospheric Oxygen, Giant Paleozoic Insects and the Evolution of Aerial Locomotor Performance , Journal of Experimental Biology 201, no. 8 (April 1, 1998), pp. 1043–1050. https://doi.org/10.1242/jeb.201.8.1043
[04] Scott C. et al., The Diversification of Paleozoic Fire Systems and Fluctuations in Atmospheric Oxygen Concentration, Proceedings of the National Academy of Sciences 103, no. 29 (July 18, 2006), pp. 10861–10865. https://doi.org/10.1073/pnas.0604090103
[05] Shanmugam P., A New Bio-Optical Algorithm for the Remote Sensing of Algal Blooms in Complex Ocean Waters, Journal of Geophysical Research: Oceans 116, no. C4 (2011). https://doi.org/10.1029/2010JC006796
[06] Basu S., et al., Colonies of Marine Cyanobacteria Trichodesmium Interact with Associated Bacteria to Acquire Iron from Dust, Communications Biology 2, no. 1 (August 2, 2019), pp. 1–8 https://doi.org/10.1038/s42003-019-0534-z
[07] Helmreich, S., The Colors of Saturated Seas, . In Saturation: An Elemental Politics, Duke University Press, 2021, p. 31. https://doi.org/10.1515/9781478013044-003
Acknowledgments
My thanks to Ariane Fong, Carsten Stabenow, Casper Schippers, Dejan Ivković, Janette Lu, Kees Tazelaar, Marcel van Wijk and Wouter Snoei. Special thanks to Daniela Gandorfer and Zulaikha Ayub for materializing aspects in the agencies of breathing and to Slought for hosting dimensions of what manifest. My utmost gratitude extends to Michaela Frühwirth and Sila Ganchrow for their endearing endurance throughout.
Text and images © Raviv Ganchrow, June 2022, unless otherwise indicated.
This project was made possible with support from Logische Phantasie Lab (LoPh) and the Conflict Shoreline Fund.